We are facing building MC60 application using OpenCPU (MC60_OpenCPU_GS3_SDK_V1.8), and have build custom application code. The problem is the application runs for few seconds (I can see the logs in QCom) and then abruptly the module crashed, followed by device restart and then it crashes at same place and this continues indefinitely.
I want to find a way to analyze the crash dump of the firmware to see the crash call stack, etc. to find the root cause, and came across Catcher tool, (shared in MC60 advanced Log Tool ) but not sure how to use it.
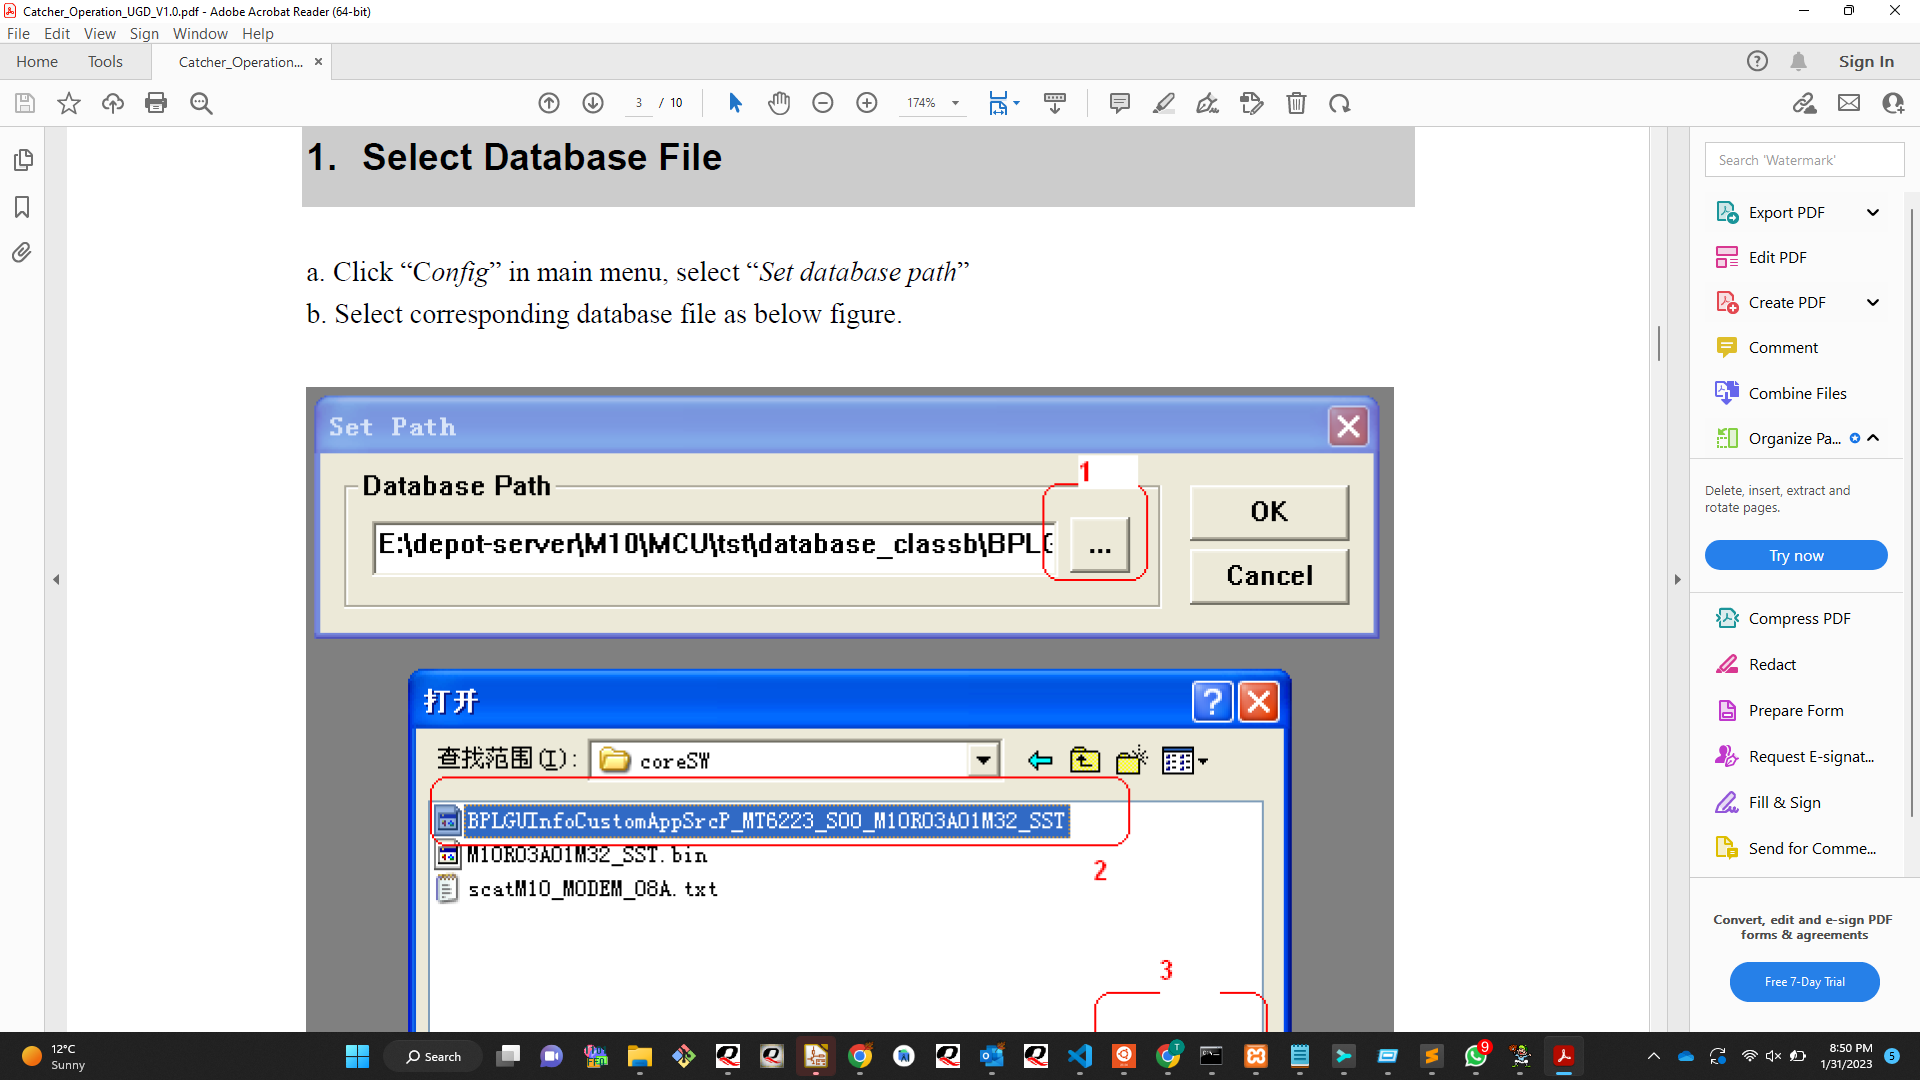
- The very first problem is where to find the database file to set “Set database path” in the Catcher application.
- How can I capture the crash dump to analyze the root cause of crash?
Can anyone help please?
@winnie.xi
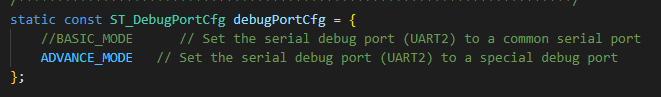
HI,I am sending you a private email. You are using the open version. You need to change the debugPortCfg configuration to ADVANCE_MODE in custom_sys_cfg.c file in the SDK\custom\config directory. As shown below (this is also described in the document), you can follow the other steps described in the document.
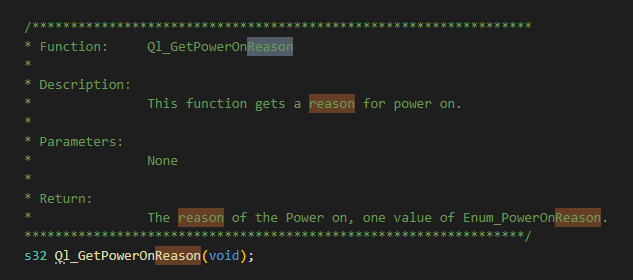
You said that the module was restarted, in my opinion, it should be caused by the reset of the watchdog or memory overflow somewhere, which is probably caused by abnormal code somewhere in sdk. Using catcher to catch the underlying log of the module may not help you, you can use the Ql_GetPowerOnReason interface to check the cause of power failure last time. This will help you find the cause of the restart
Good luck
@vincent.ding-Q Thank you for your response. The reset seems to be caused by Abnormal Exit due to memory corruption (either in application code or in SDK) (we verified its not because of watchdog). What is the best way to identify the call stack/crash dump of the Abnormal exit so that the reason for the memory corruption be investigated.
Thanks.